LUXURY GUIDE
Some of the Most Valuable Waterfront in Texas, and Rarely for Sale
Constant-level water from Tom Miller Dam to Mansfield Dam; only 34 waterfront homes closed on the MLS in three years, and more trade privately.
Data through Nov. 11, 2026 · Updated quarterly · Source: Unlock MLS
Last 12 months
MEDIAN PRICE
$5.97M
3 yrs: $5.0M
TYPICAL DAYS TO SELL
131
3 yrs: 122
SALE TO ORIGINAL LIST
86.7%
3 yrs: 87.1%
PRICE PER SQ FT
$1,424
3 yrs: $1,126
Lake Austin at a Glance
The median Lake Austin waterfront home sold on the MLS for about $5.0 million over the last three years, at $1,126 per square foot, on about two-thirds of an acre.
See the analysis
AREAS · LAKE AUSTIN · WATERFRONT
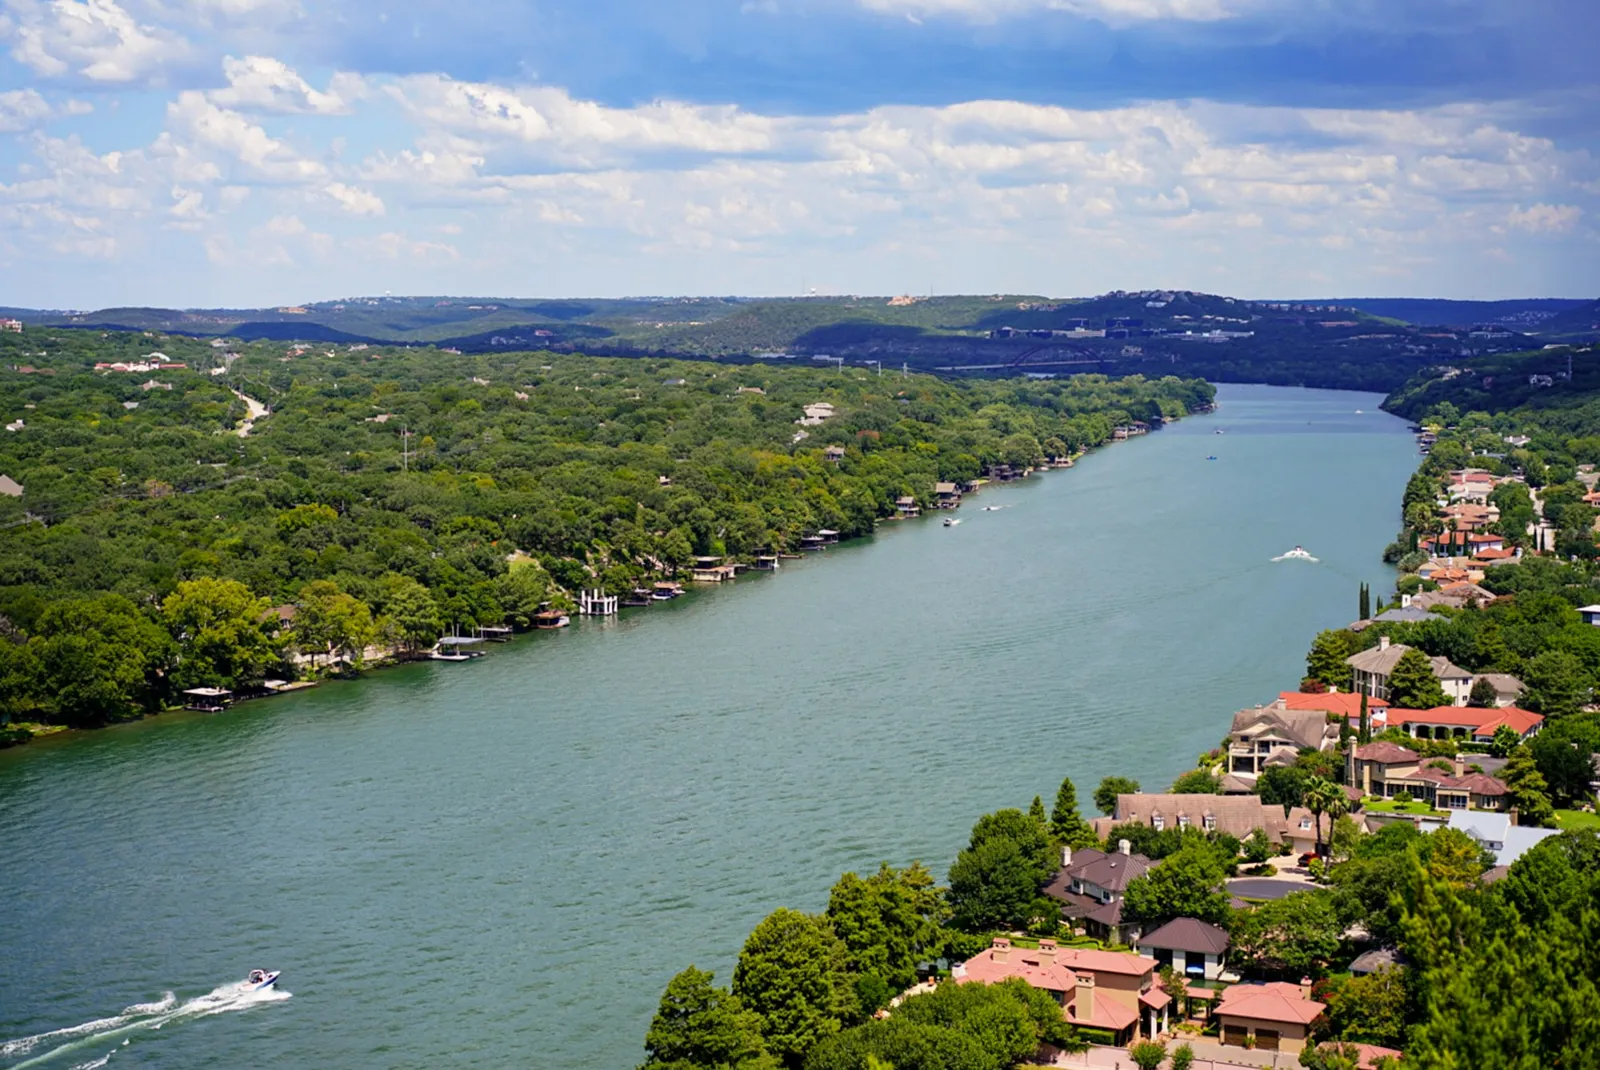
Lake Austin is the narrow, constant-level lake that runs from Tom Miller Dam in west Austin up to Mansfield Dam, with Tarrytown, Westlake and the 78730 hills along its shores. Waterfront homes here are some of the most valuable in Texas, and they rarely come up for sale: 34 waterfront single-family homes closed on the MLS in the last three years. More trade privately and never reach the MLS.
The typical home is about 4,300 square feet and was built before 2015, so buyers are paying mostly for the shoreline, the dock and the view rather than the house. The top MLS sales reached about $8.75M; the largest estates often sell privately.
The lake was formed when Tom Miller Dam was completed in 1939. It is owned by the City of Austin and operated by the Lower Colorado River Authority, and because water passes through from Lake Travis it stays close to a constant level most of the year. That is the big difference from Lake Travis: a Lake Austin dock is usable almost every day, which is why buyers pay a premium for it.
Waterfront Is the Most Difficult Asset to Price
Most Lake Austin waterfront homes sat for months and closed about 18% below their first price.
See the analysis
Waterfront Is the Most Difficult Asset to Price
Sold price as a share of original list price, by time on market.
Along the Shoreline
Central shore (Tarrytown, Scenic Drive, Scout Island, Mount Bonnell) — 9 sales, median $3.4M, 92 days, 82.0% of original list, $689 per sq ft. Closest to downtown, often smaller lots and a more urban setting.
See the analysis
- Central shore (Tarrytown, Scenic Drive, Scout Island, Mount Bonnell) — 9 sales, median $3.4M, 92 days, 82.0% of original list, $689 per sq ft. Closest to downtown, often smaller lots and a more urban setting.
- Westlake east (Lakeshore Drive, Westlake Cove, Island on Westlake, Valley Springs) — 6 sales, median $6.0M, 226 days, 86.2%, $1,786 per sq ft. The highest price per foot on the lake, and the slowest to sell.
- Westlake west and Rivercrest (Rob Roy on the Lake, Rivercrest, Elfland, Bruton Springs, Island Wood, River Hills) — 10 sales, median $5.1M, 132 days, 87.1%, $1,430 per sq ft.
- North shore (Ski Shores, Manana, Greenshores, Big View) — 9 sales, median $5.1M, 75 days, 87.4%, $1,065 per sq ft. More land and Hill Country views farther from town.
By Stretch of Shoreline
| Stretch | Sales | Median price | Median $/sq ft | Median days | Sold and original list |
|---|---|---|---|---|---|
| Central shore | 9 | $3.40M | $689 | 92 | 82.0% |
| Westlake east | 6 | $6.03M | $1,786 | 226 | 86.2% |
| Westlake west and Rivercrest | 10 | $5.08M | $1,430 | 132 | 87.1% |
| North shore | 9 | $5.05M | $1,065 | 75 | 87.4% |
By Price Range
| Range | Sales | Median price | Median $/sq ft | Median days | Sold and original list |
|---|---|---|---|---|---|
| Under $3M | 5 | $2.10M | $530 | 59 | 89.8% |
| $3M–$6M | 19 | $4.89M | $1,065 | 122 | 87.4% |
| $6M and up | 10 | $7.65M | $1,481 | 140 | 84.7% |
By Year
| Year | Sales | Median price | Median days | Sold and original list |
|---|---|---|---|---|
| 2024 | 5 | $3.45M | 189 | 78.4% |
| 2025 | 19 | $4.75M | 75 | 88.3% |
| 2026 (to Nov. 11) | 10 | $6.23M | 204 | 84.2% |
How David Evaluates a Lake Austin Home
The dock comes first. Whether there is a permitted dock or boathouse, how deep the water is at the dock, and whether it can be rebuilt drive value more than the house.
See the analysis
- The dock comes first. Whether there is a permitted dock or boathouse, how deep the water is at the dock, and whether it can be rebuilt drive value more than the house. Dock and shoreline work needs permits and can take months.
- Frontage and shoreline. Feet of frontage, a flat or bluff shoreline, and how the lot meets the water change both price and upkeep.
- Main channel and cove. Open-water views and wake exposure on the main channel trade differently from quiet coves.
- Flood and access. Elevation, flood zone and the drive down to the water affect insurance, building and daily use.
- The house is often secondary. Many buyers plan to renovate or rebuild, so the lot, view and water access set the floor.
What This Means for Sellers
Price to the shoreline, not the square footage.
See the analysis
The waterfront homes that sat lost far more than they would have by pricing right at launch. Have the dock permits, surveys and any shoreline work documented before you list.
What This Means for Buyers
Lake Austin homes rarely come up, and the best ones may sell privately, so tell David exactly what you want before it hits the market.
See the analysis
Homes past 60 days have closed well under their first price, and a marine survey and permit check belong in every contract.
How these numbers are measured
Headline cards: last 12 months. Tables and charts: last 3 years. Source: Unlock MLS (ACTRIS), 34 closed single-family homes with Lake Austin frontage (waterfront features: lake front, river front, waterfront or pier) in ZIPs 78703, 78730, 78731, 78732, 78733 and 78746, Nov. 2023 to Nov. 2026. Excludes Lake Travis and Steiner Ranch lake lots. Private and off-MLS sales are not included, so the true market is larger. Medians; small sample. Information deemed reliable but not guaranteed.
Thinking about selling on Lake Austin?
Source: Unlock MLS (ACTRIS), 34 closed single-family homes with Lake Austin frontage (waterfront features: lake front, river front, waterfront or pier) in ZIPs 78703, 78730, 78731, 78732, 78733 and 78746, Nov. 2023 to Nov. 2026. Excludes Lake Travis and Steiner Ranch lake lots. Private and off-MLS sales are not included, so the true market is larger. Medians; small sample. Information deemed reliable but not guaranteed. Headline cards: last 12 months. Tables and charts: last 3 years.
Information is deemed reliable but not guaranteed and should be independently verified. The Austin Board of REALTORS®, ACTRIS and their affiliates provide the MLS and its content as-is, without warranty.
Listing expired or withdrawn? Request a complimentary review.