LUXURY GUIDE
Sixty-Five Miles of Shoreline, from Lake Cottages to Grand Estates
A larger, more varied waterfront market than Lake Austin, with homes from under $1 million to above $13 million.
Data through Nov. 11, 2026 · Updated quarterly · Source: Unlock MLS
Last 12 months
MEDIAN PRICE
$1.31M
3 yrs: $1.29M
TYPICAL DAYS TO SELL
91
3 yrs: 87
SALE TO ORIGINAL LIST
88.8%
3 yrs: 88.8%
PRICE PER SQ FT
$397
3 yrs: $409
Lake Travis at a Glance
The median Lake Travis waterfront home sold for about $1.29 million over the last three years, at $409 per square foot.
See the analysis
AREAS · LAKE TRAVIS · WATERFRONT
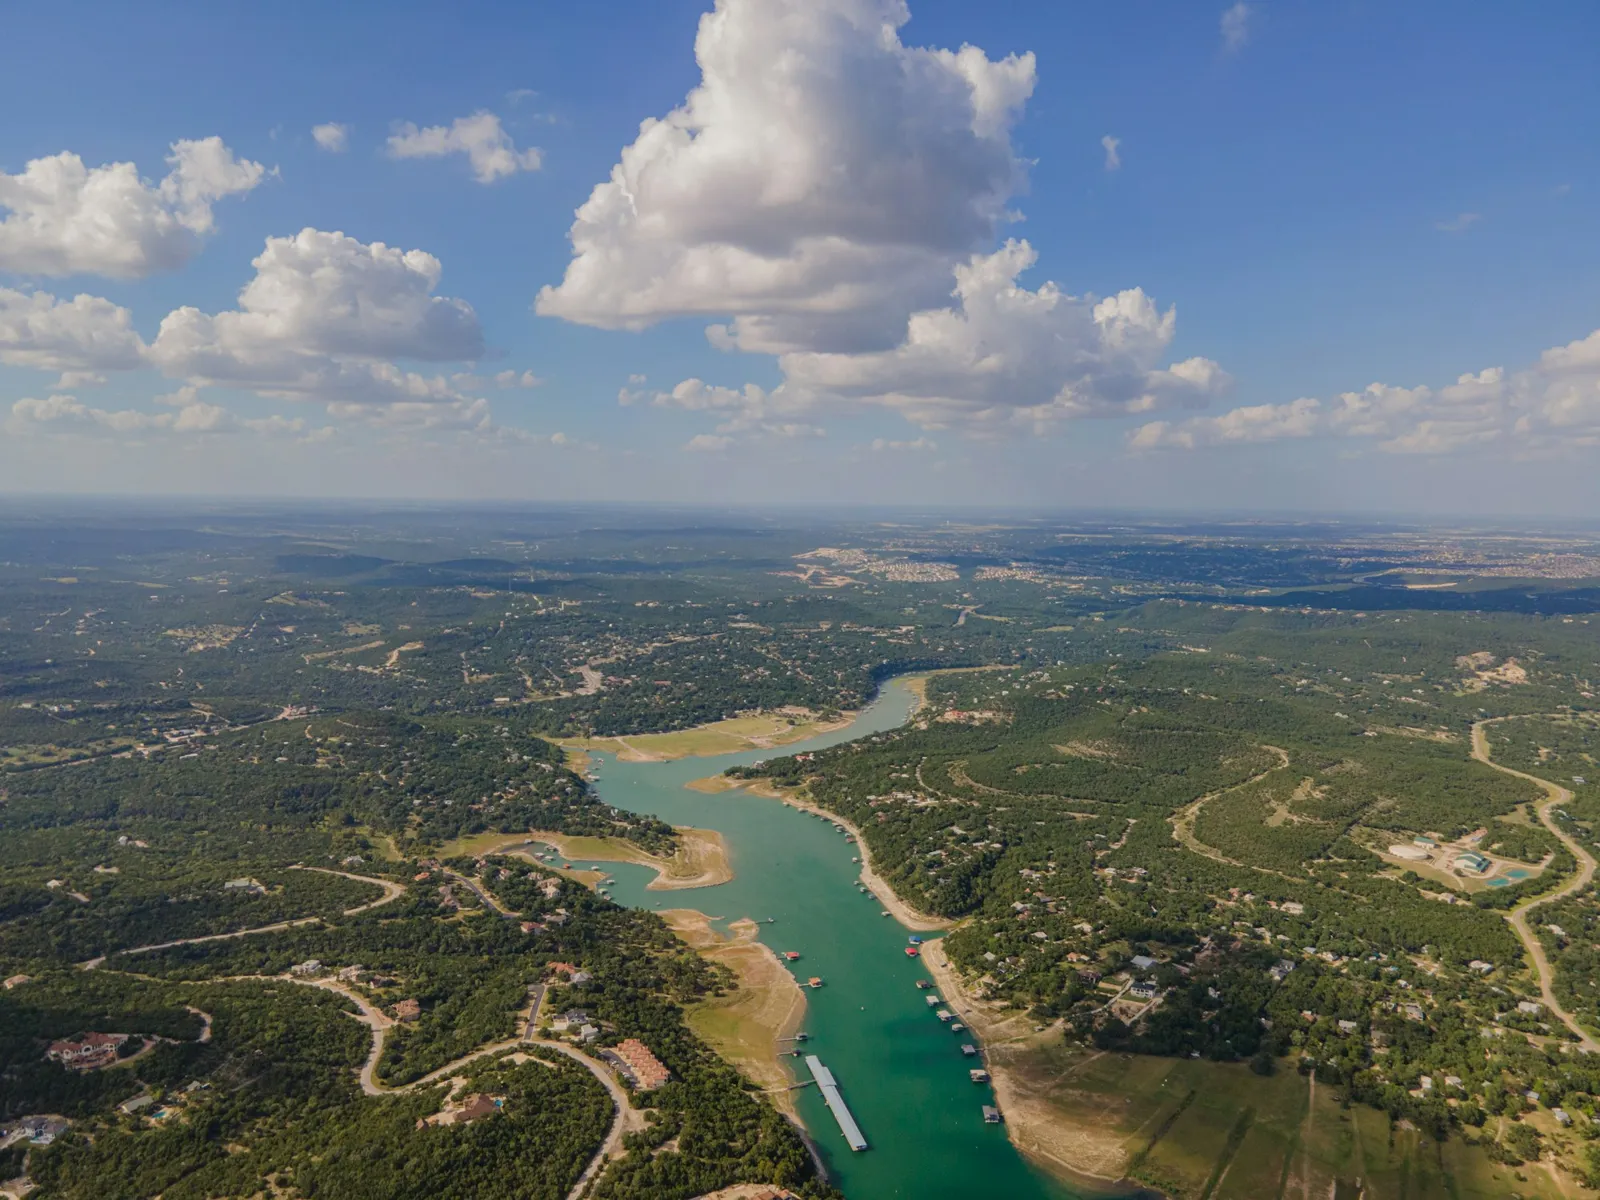
Lake Travis stretches about 65 miles up the Colorado River from Mansfield Dam, with Lakeway, the 78732 and 78734 hills, Spicewood, Lago Vista and Point Venture along its shores. It is a much bigger and more varied waterfront market than Lake Austin: 264 waterfront single-family homes closed on the MLS in the last three years, from lake cottages under $1M to estates above $13M.
The typical home is about 3,150 square feet on more than an acre. The luxury tier is distinct: 66 waterfront homes sold for $2M or more, and those closed closer to their first price than the rest of the lake (92.3% for $2M–$4M). The south shore near Lakeway and west Austin is the priciest, with a $1.66M median.
Unlike Lake Austin, Lake Travis is a flood-control reservoir operated by the Lower Colorado River Authority, so its level rises and falls with drought and rain. After years of low water, the July 2025 Hill Country floods brought it close to full. For a buyer, the lake level on the day you tour is not the lake level you will always have, which is why dock design and water depth matter so much here.
By Year
| Year | Sales | Median price | Median $/sq ft | Median days | Sold and original list |
|---|---|---|---|---|---|
| 2024 | 67 | $1.50M | $473 | 90 | 87.9% |
| 2025 | 83 | $1.18M | $388 | 75 | 88.9% |
| 2026 (to Nov. 11) | 112 | $1.30M | $400 | 91 | 88.9% |
Time on Market Shapes the Final Price
A quarter of Lake Travis waterfront homes sold within a month at about 97% of their first price.
See the analysis
Time on Market Shapes the Final Price
Sold price as a share of original list price, by time on market.
Along the Shoreline
South shore: Lakeway and west Austin (78732, 78734) — 77 sales, median $1.66M, 72 days, 89.8% of original list, $500 per sq ft. The highest prices on the lake, close to Lakeway, Bee Cave and the Hill Country Galleria, with Lake Travis ISD or Leander ISD schools depending on the address.
See the analysis
- South shore: Lakeway and west Austin (78732, 78734) — 77 sales, median $1.66M, 72 days, 89.8% of original list, $500 per sq ft. The highest prices on the lake, close to Lakeway, Bee Cave and the Hill Country Galleria, with Lake Travis ISD or Leander ISD schools depending on the address.
- Spicewood and the Pedernales arm (78669) — 109 sales, median $975K, 96 days, 88.1%, $373 per sq ft. More land and quieter water, from coves to the Pedernales River arm.
- North shore: Lago Vista, Jonestown and Point Venture (78645) — 78 sales, median $1.31M, 68 days, 88.2%, $406 per sq ft. Sunset views and a longer drive into Austin.
By Shoreline
| Shoreline | Sales | Median price | Median $/sq ft | Median days | Sold and original list |
|---|---|---|---|---|---|
| South shore (Lakeway, west Austin) | 77 | $1.66M | $500 | 72 | 89.8% |
| Spicewood and Pedernales arm | 109 | $975K | $373 | 96 | 88.1% |
| North shore (Lago Vista, Jonestown, Point Venture) | 78 | $1.31M | $406 | 68 | 88.2% |
By Price Range
| Range | Sales | Median price | Median $/sq ft | Median days | Sold and original list |
|---|---|---|---|---|---|
| Under $1M | 94 | $737K | $324 | 96 | 87.9% |
| $1M–$2M | 104 | $1.44M | $408 | 82 | 86.3% |
| $2M–$4M | 51 | $2.70M | $566 | 81 | 92.3% |
| $4M and up | 15 | $6.15M | $785 | 92 | 89.8% |
Days on Market
| Days | Sales | Median price | Median days | Sold and original list |
|---|---|---|---|---|
| 0–30 | 66 | $1.30M | 13 | 96.9% |
| 31–90 | 70 | $1.45M | 53 | 90.4% |
| 91–180 | 68 | $1.20M | 125 | 84.7% |
| 181+ | 60 | $1.12M | 274 | 76.2% |
How David Evaluates a Lake Travis Home
Water at low lake, not just full lake. Where the shoreline sits when the lake drops, the depth at the dock and the slope to the water decide how usable the waterfront is year-round.
See the analysis
- Water at low lake, not just full lake. Where the shoreline sits when the lake drops, the depth at the dock and the slope to the water decide how usable the waterfront is year-round.
- Dock design. Floating docks that can move with the lake, permits through LCRA or the local city, and the condition of the dock and lift are major value items.
- Main basin and cove. Open-water views and big sunsets on the main basin trade differently from calm, protected coves.
- Access and topography. Steep lots can mean dramatic views and hard daily access; trams, stairs and parking matter to buyers.
- Community and commute. Lakeway, Bee Cave and strong school districts pull the south shore up; distance to Austin and to services shapes the rest.
What This Means for Sellers
Price for the first month.
See the analysis
Lake Travis buyers compare every waterfront listing on the lake, and homes that started high and sat gave up far more than a sharp launch price would have cost. Document the dock, permits and water depth before you list.
What This Means for Buyers
There is more choice here than on Lake Austin, and real room to negotiate on homes past 90 days.
See the analysis
Verify the water at your shoreline at a lower lake level, and get a dock and marine inspection before you commit.
How these numbers are measured
Headline cards: last 12 months. Tables and charts: last 3 years. Source: Unlock MLS (ACTRIS), 264 closed single-family homes with Lake Travis waterfront features (lake front, river front, waterfront or pier) in ZIPs 78645, 78669, 78732, 78734 and 78738, Nov. 2023 to Nov. 2026. Includes some Pedernales River arm frontage; excludes Lake Austin homes. Medians; private sales not included. Information deemed reliable but not guaranteed.
Thinking about selling on Lake Travis?
Looking below the luxury market? See the Lake Travis area guide
Source: Unlock MLS (ACTRIS), 264 closed single-family homes with Lake Travis waterfront features (lake front, river front, waterfront or pier) in ZIPs 78645, 78669, 78732, 78734 and 78738, Nov. 2023 to Nov. 2026. Includes some Pedernales River arm frontage; excludes Lake Austin homes. Medians; private sales not included. Information deemed reliable but not guaranteed. Headline cards: last 12 months. Tables and charts: last 3 years.
Information is deemed reliable but not guaranteed and should be independently verified. The Austin Board of REALTORS®, ACTRIS and their affiliates provide the MLS and its content as-is, without warranty.
Listing expired or withdrawn? Request a complimentary review.